luni, 23 martie 2015

A RATHER ODD GROUP OF OLD NEWS - WHAT ABOUT THE PALEO DRAINAGE SYSTEM BEFORE MEN ROAMS THE OLDUVAI GORGE ...BY GEORGE ...

 Does not seem to have slowed down any.  Click to animate.
»
Lets not forget the facts, see what I read in the newspaper today:

* jakobshavn canal.PNG (886.7 kB, 526x700 - viewed 172 times.)
Here it is:

* Landsat 2015-02-21-vs-sep28-2014.jpg (147.22 kB, 690x752 - viewed 18 times.)
Believe it or not! Massive calving seen at the southern branch of Jakobshavn Isbræ
together with this animation created using images from the Landsat 8 Operational Land Imager:
Jakobshavn-feb12-feb19-2015-2
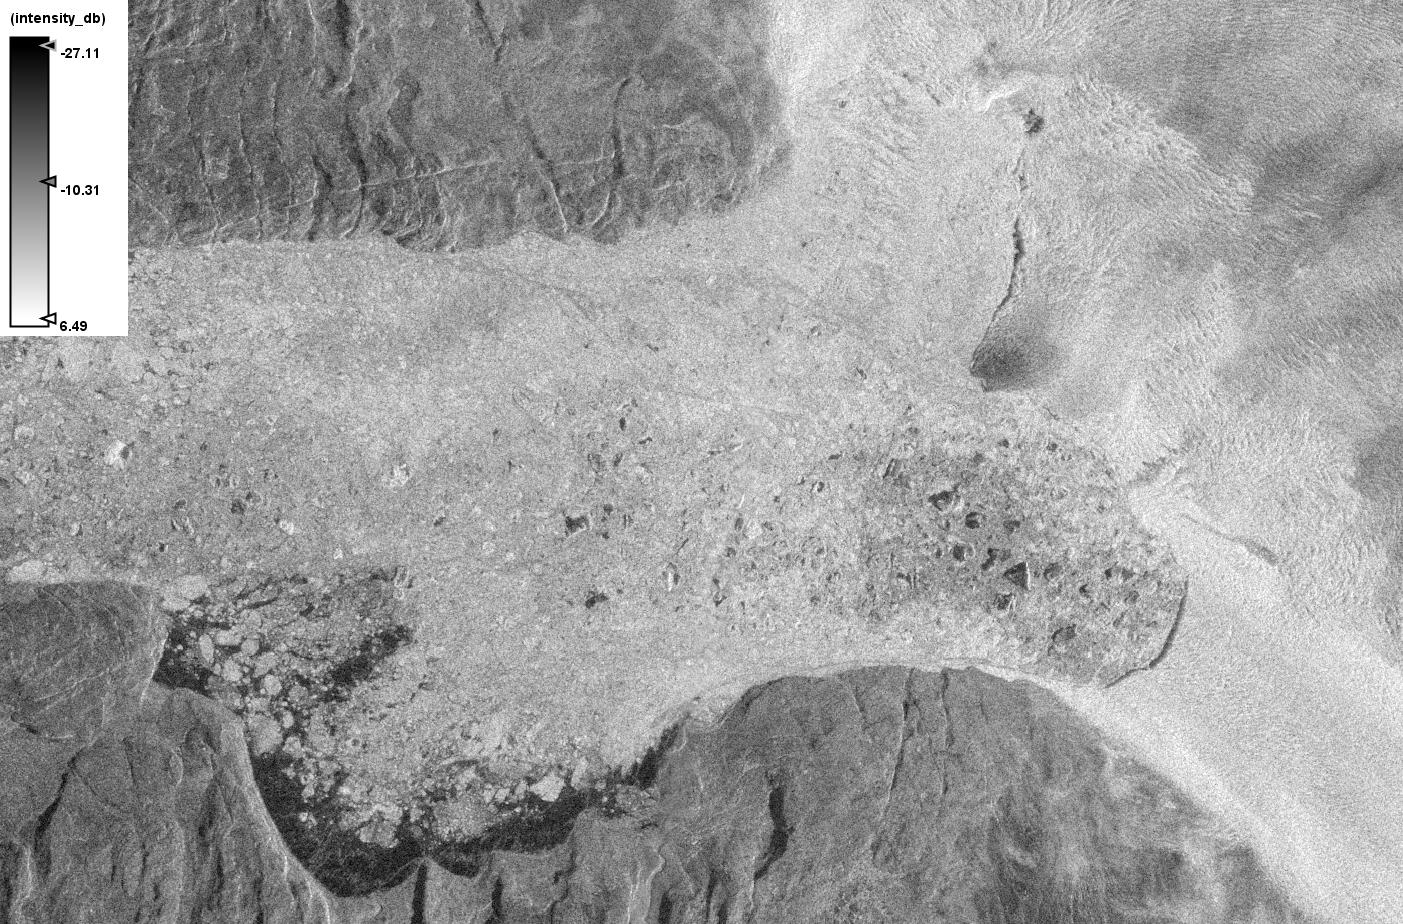
We’ve just grabbed this Sentinel-1A synthetic aperture radar image from February 15th 2015 via Polarview, which appears to suggest that the calving took place before 20:38 UTC on that date:
S1A_Jakobshavn_20150215T203828
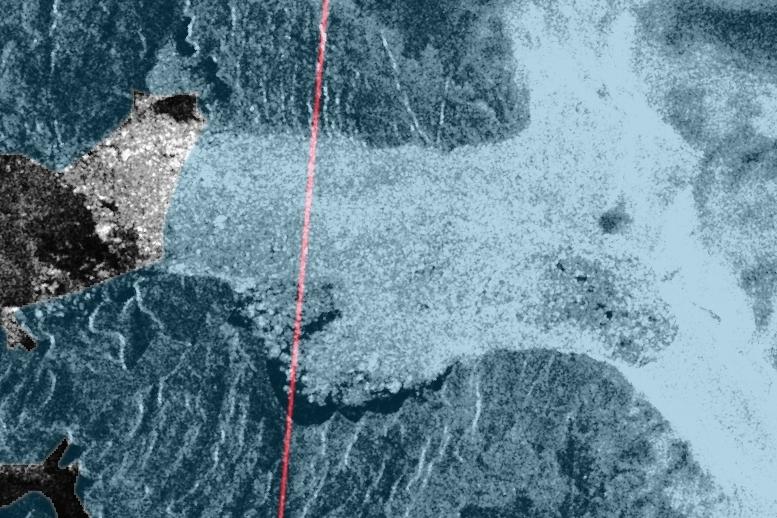
Here’s a Sentinel-1A image via “nukefix” at the Arctic Sea Ice Forum, which confirms that the calving took place on or before February 16th:
subset_0_of_S1A_IW_GRDH_1SSH_20150216T095944_20150216T100009_004647_005BB8_B43C_Calib_EC_Sigma0_HH_db
This is a before/after animation from “A-Team” on the Arctic Sea Ice Forum, using 15m resolution Landsat images:
Jakobshavn-anim
Finally, for the moment at least, Espen Olsen provides an illustration of the retreat of the calving face of Jakobshavn Isbræ since 1851:
Jakobshavn-calving1851-2014
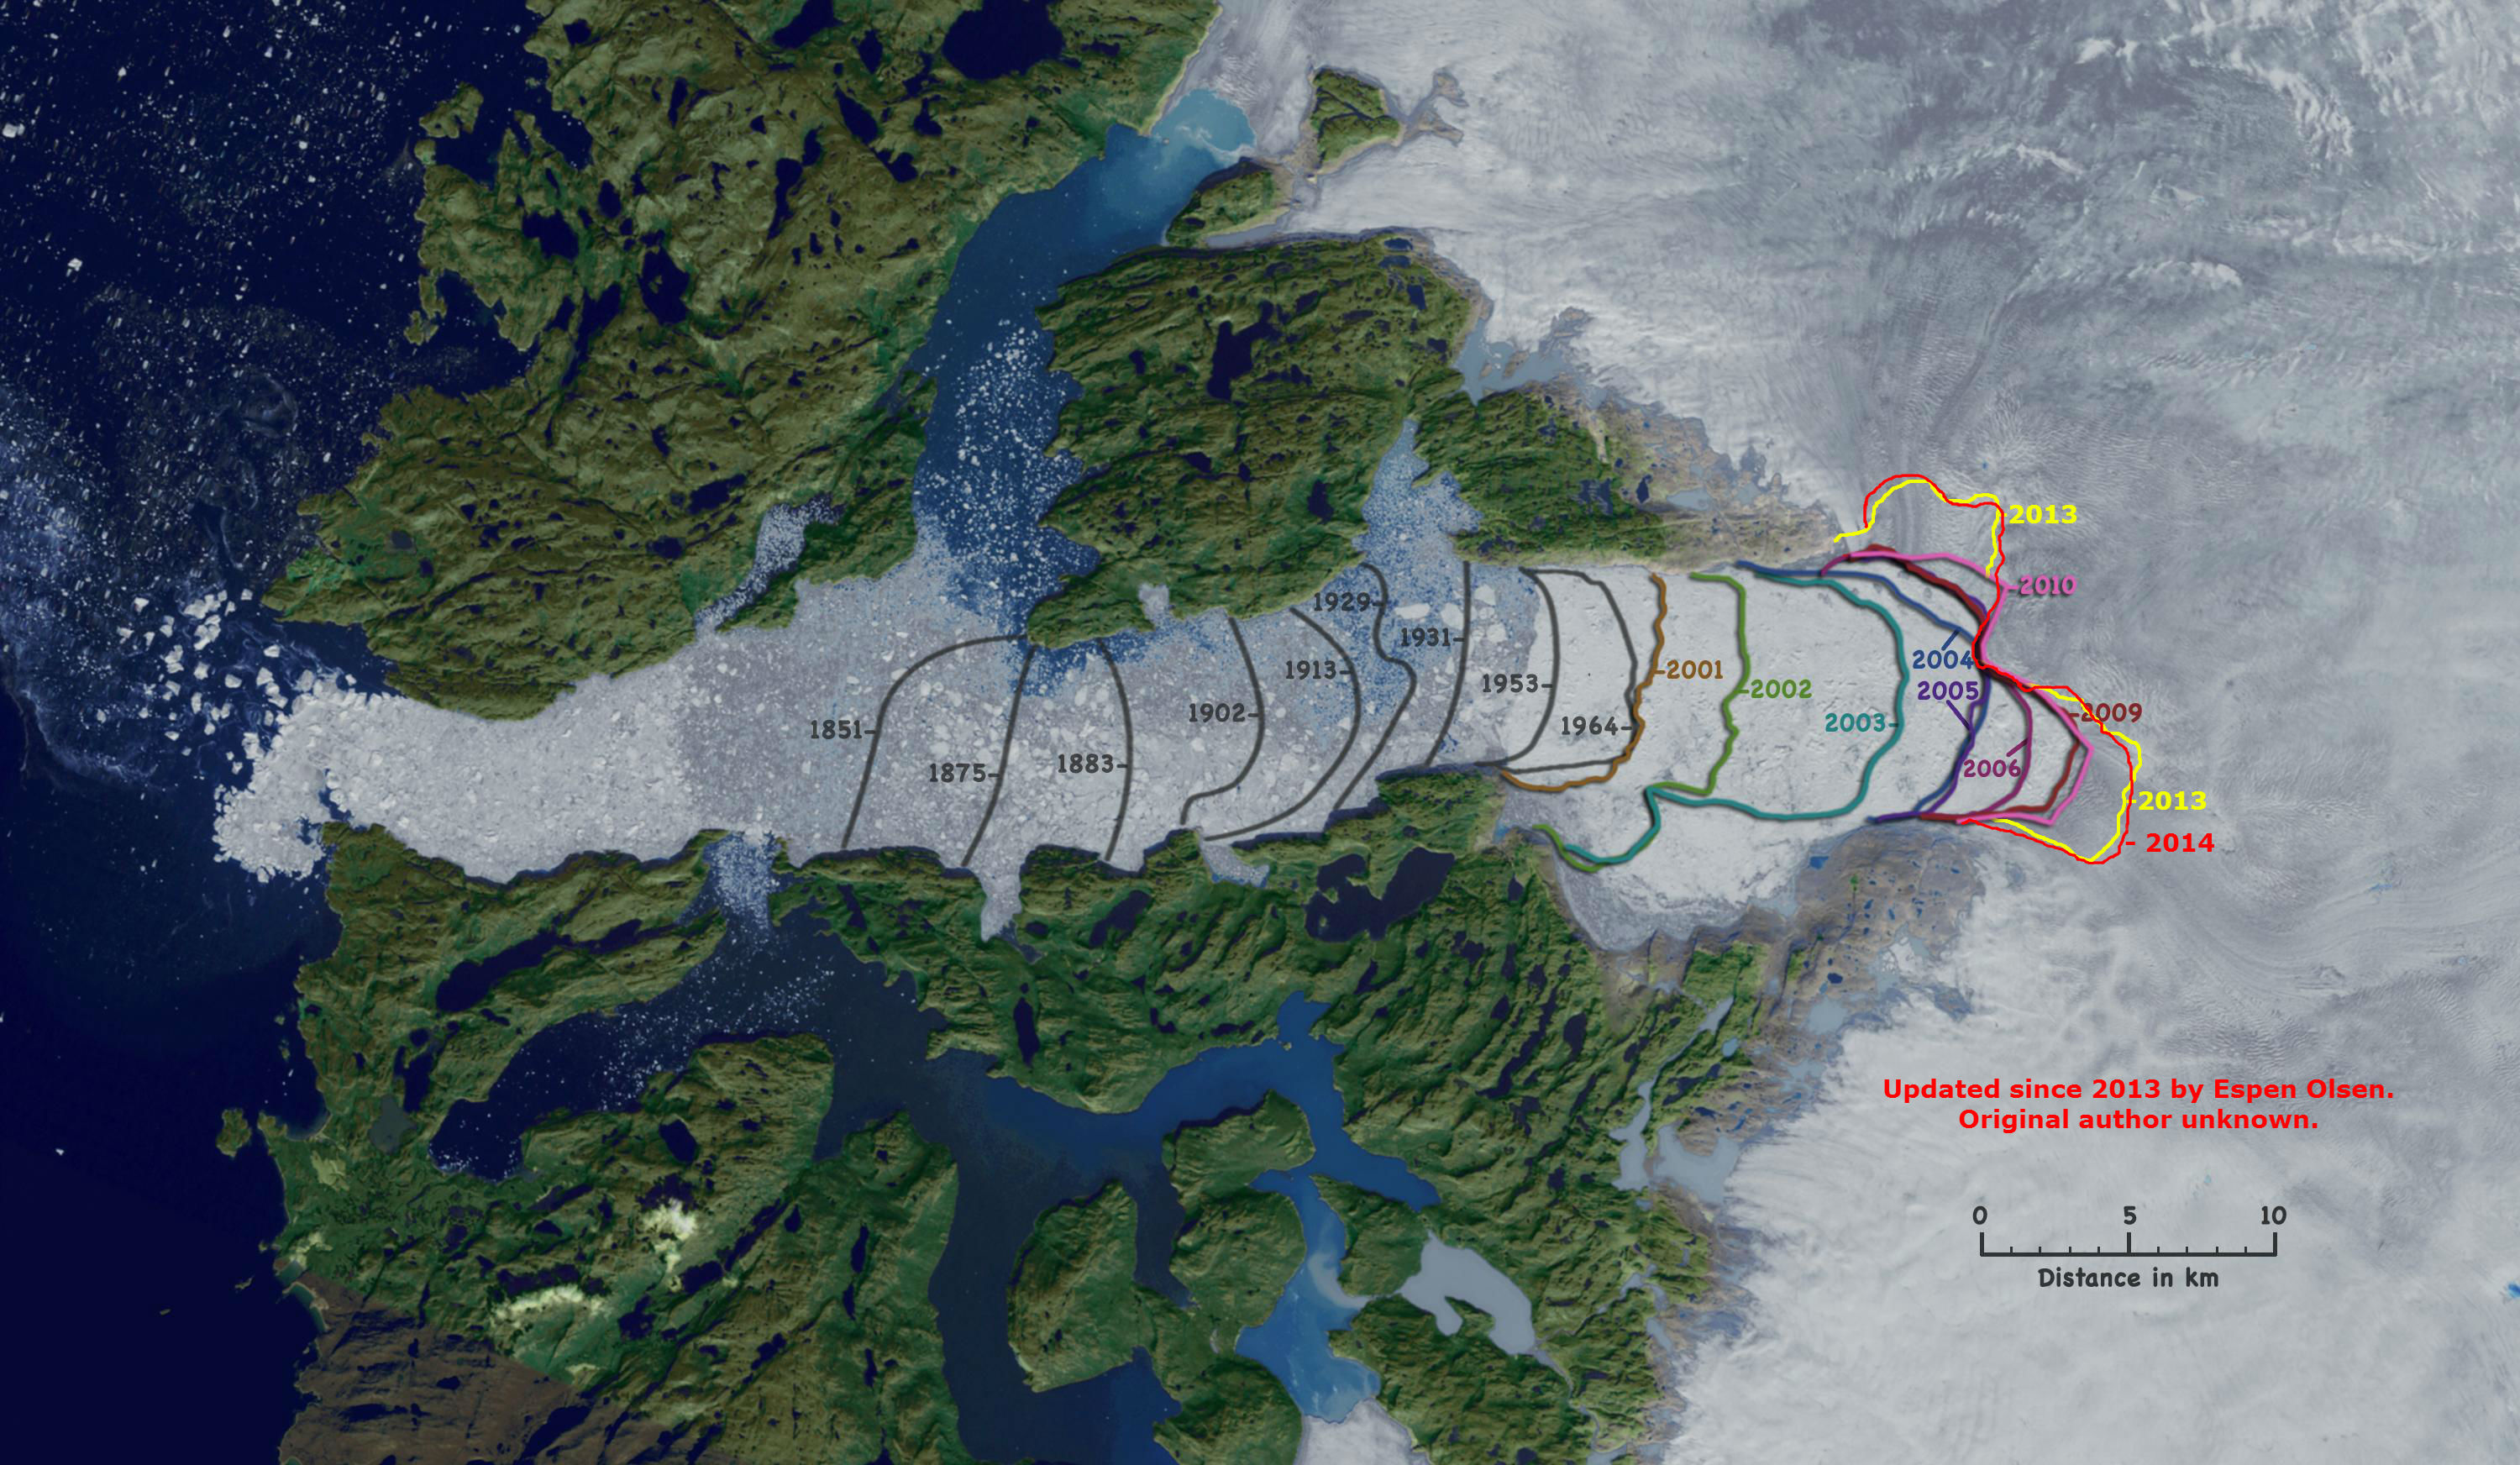
This most recent event does not bring the calving face further east than the position in summer 2014. However the sun’s rays are only just returning to that part of the planet, and the next one may well do so.
[Edit - 24/02/2015]
We’ve phoned DMI and NSIDC as well, but Jason Box who is a Professor at the Geological Survey of Denmark and Greenland has been the first to respond with an opinion about how unusual this event is:
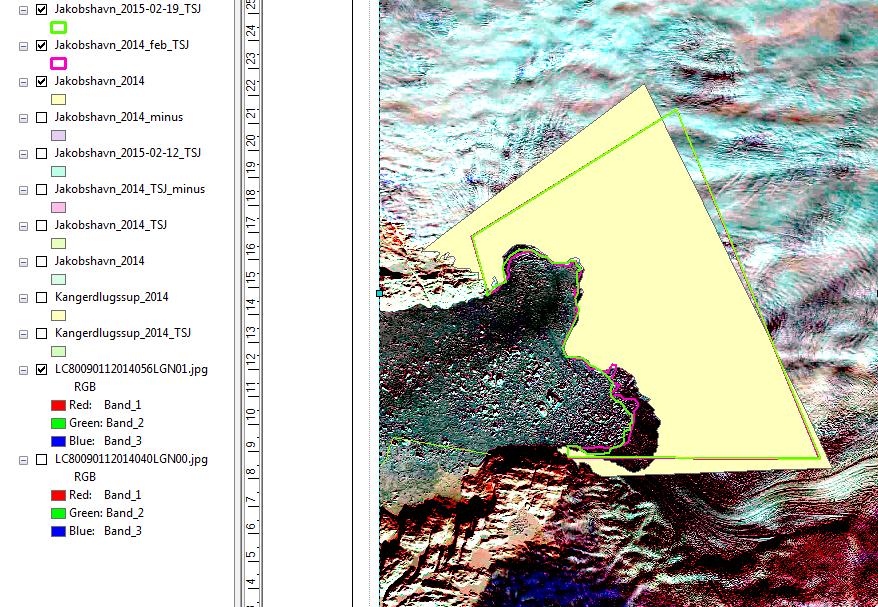
It’s an interesting finding. In the attached prepared by Karina Hansen you will see a light yellow polygon illustrating the end of melt season 2014 ice. Jakobshavn front position retreated from the Feb 2014 (pink line) and Feb 2015 (green line) positions. The Feb 2014 and Feb 2015 positions are roughly the same with 2014 Feb being further retreated than Feb 2015:
Jaki_2015
A cautious response: even if this calving were abnormal, we will likely see an advance in the next weeks that will fill the void. Why?
A) This glacier flows fast, and
B) Now with less flow resistance there will likely be an acceleration making the void filling happen even faster.
Here are annual end of melt season area changes measured by PROMICE.org. These are being updated. I will ask Karina Hansen today to update for 2014 and 2015. We could have that result in a few hours.

luni, 9 martie 2015

Loose ICE (University of Rhode Island) "Cracks in the Cryosphere: How Changes in Sea Ice Can Upset the Ocean Carbon Cycle (Universite Libre de ICE IV "The Cryosphere Between the Cracks AND THE CRACKPOTS: Does It Matter TO THE MARCHING MORONS GOING UP A DIME BIGGEST YEAR IN NASDAQ IN YEARS THE XXI CENTURY FOX IS JUST FINE AND GOING TO GO FINER OR THINNER SOMETHING LIKE THIS OR LIKE THAT TIT FOR TAT

Arctic sea ice extent continues to track well below average, but it is still unclear whether March will see an increase in ice, or establish a record low maximum. Regionally, Arctic ice extent is especially low in the Sea of Okhotsk and the Bering Sea. In the Antarctic, sea ice shrank to the fourth highest minimum in the satellite record.

Overview of conditions

Figure 1. Arctic sea ice extent for February 2015
Figure 1. Arctic sea ice extent for February 2015 was 14.41 million square kilometers (5.56 million square miles). The magenta line shows the 1981 to 2010 median extent for that month. The black cross indicates the geographic North Pole. Sea Ice Index data.About the data

Credit: National Snow and Ice Data Center
High-resolution image
Arctic sea ice extent in February averaged 14.41 million square kilometers (5.56 million square miles). This is the third lowest February ice extent in the satellite record. It is 940,000 square kilometers (362,900 square miles) below the 1981 to 2010 long-term average of 15.35 million square kilometers (5.93 million square miles). It is also 50,000 square kilometers (19,300 square miles) above the record low for the month observed in 2005.
With the Arctic Ocean completely ice covered, the remaining areas of potential new ice growth are limited to the margins of the pack in the northern Pacific and northern Atlantic. Sea ice extent is below average across the entire sea ice margin, most prominently along the Pacific sectors. A small region of above-average ice extent is located near Newfoundland and the Canadian Maritime Provinces.
The Arctic maximum is expected to occur in the next two or three weeks. Previous years have seen a surge in Arctic ice extent during March (e.g., in 2012, 2014). However, if the current pattern of below-average extent continues, Arctic sea ice extent may set a new lowest winter